Data Visualizations

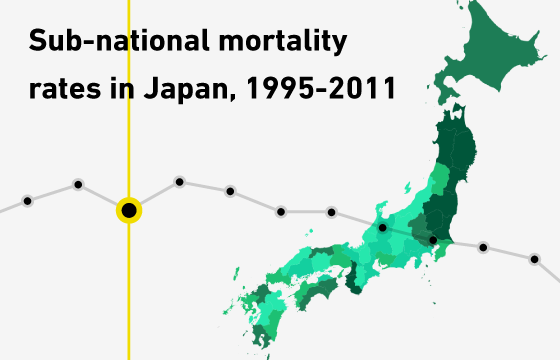
Sub-national mortality rates in Japan, 1995-2011
About
View mortality rates in Japan at the prefectural level for the period 1995-2011, by cause of death and sex. This visualization shows the mortality rate and the rate of years of life lost (YLLs), per 100,000 population. The visualization is arranged at four levels, starting with the total mortality or YLL rate for each prefecture, and then by category of cause of death: from the broadest (infectious disease, non-communicable disease, and injury) to the narrowest categories (such as specific cancer sites). Click on a prefecture to view the time trend of death and YLLs for that cause in that prefecture. Use the drop down menus above the map or the charts to select a different cause of death or level of detail. Hover the mouse over a region of the chart to see the exact value of the rate. Use the buttons at the bottom to switch between male, female and both sexes, and to change the prefecture.

Note: YLLs measure the total years of life that are lost in Japan to disease because of early death. For example, if a person dies of cancer at age 50, then they have lost more than 30 years of life that they could have expected to live.
Browser
To make sure you have best experience possible, we recommend using the most up-to-date version of one of the following browsers:
Internet Explorer 11 ~
Google Chrome 55.0.x ~
Mozilla Firefox 51.0.x ~
Safari 10.0.x ~
Other browsers may have difficulty displaying the full functionality of this site.
Citation
Made with Natural Earth. Free vector and raster map data @ naturalearthdata.com.
http://www.naturalearthdata.com/
This is an open source mapping application. Small details of the map may vary from official Japanese geography.
Data
Mortality data was obtained from the Japan Vital Registration system and combined with life expectancy data from the Institute for Health Metrics and Evaluation (IHME) to calculate years of life lost. Deaths were categorized using Global Burden of Disease Project categories. All rates are standardized relative to the national population for the nearest census year. Crude mortality rates are not shown and can differ substantially from standardized rates.