Data Visualizations
-
March 29, 2019
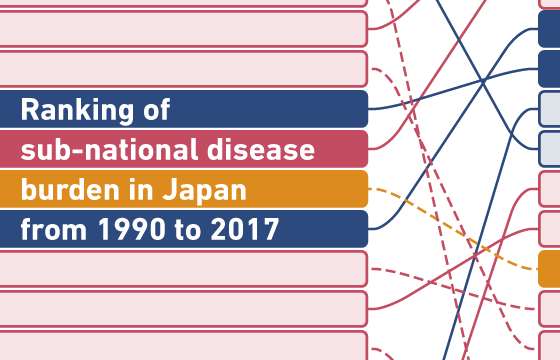
Ranking of sub-national disease burden in Japan from 1990 to 2017
This study aims to visualize the cause-specific disease burden in Japan at the prefectural level. We have analyzed and ranked the cause-specific all-age…
MORE
-
February 24, 2019
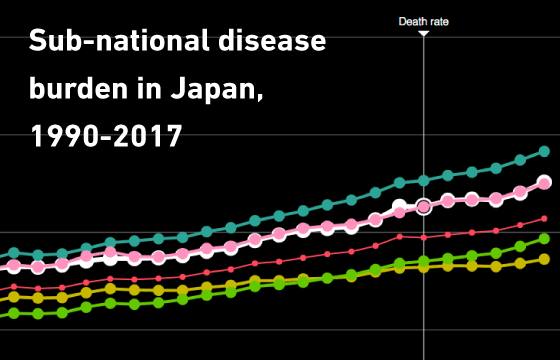
Sub-national disease burden in Japan, 1990-2017
View all-age and age-standardized rates (per 100,000 population) for mortality, Years of Life Lost (YLLs), Years Lived with Disability (YLDs), Disabilit…
MORE
-
November 24, 2017
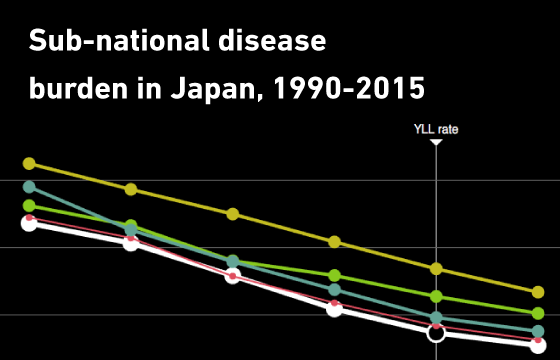
Sub-national disease burden in Japan, 1990-2015
View age-standardized rates (per 100,000 population) for mortality, Years of Life Lost (YLLs), Years Lived with Disability (YLDs), Disability-Adjusted L…
MORE
-
February 13, 2017
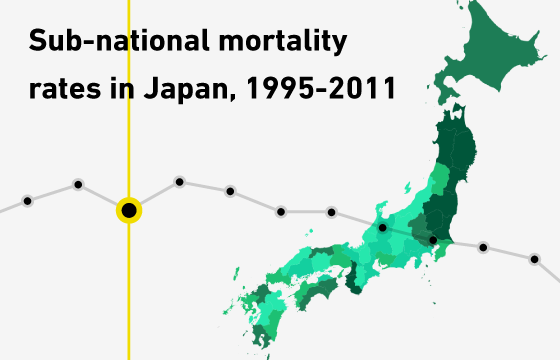
Sub-national mortality rates in Japan, 1995-2011
View mortality rates in Japan at the prefectural level for the period 1995-2011, by cause of death and sex. This visualization shows the mortality rate …
MORE
-
April 15, 2016
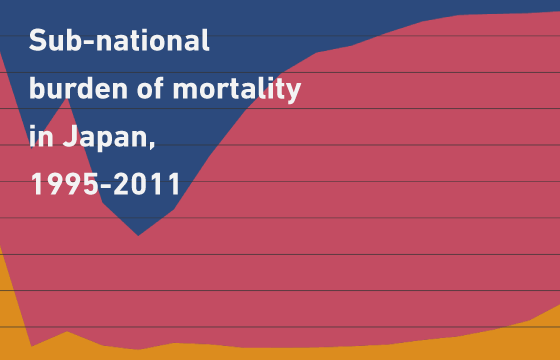
Sub-national burden of mortality in Japan, 1995-2011
View the burden of mortality in Japan at the prefectural level for the period 1995-2011, by cause of disease and sex. This visualization shows the total…
MORE
-
August 7, 2015
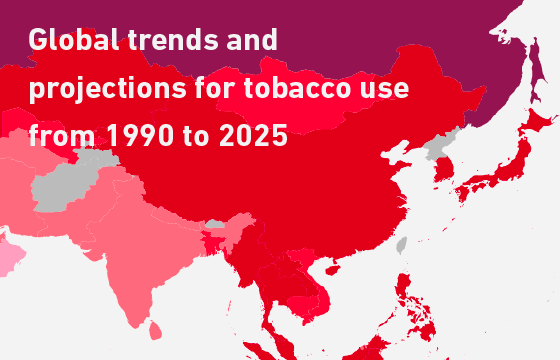
Global trends and projections for tobacco use from 1990 to 2025
View the progress any country is making towards reducing tobacco use and achieving global targets set by the World Health Organization (WHO). You can se…
MORE
-
May 31, 2015
Burden of disease and research funding in Japan
View the burden of disease in Japan or total scientific research funding allocations by disease category and over time (2000 – 2012). This visualization…
MORE
Not Found
